

Candlestick
35 Essential Candlestick

Key Takeaways
- Candlestick Patterns: These patterns help traders read market psychology and predict price movements by analysing buyer and seller activity.
- Main Types: Candlestick formations are broadly classified into reversal and continuation types depending on trend direction.
- Bullish Reversal Candlestick: Appears after a downtrend, suggesting buyers are gaining strength and prices may move up.
- Bearish Reversal Candlestick: Forms after an uptrend, indicating sellers are taking control and a price decline may follow.
- Continuation & Neutral Patterns: Reflect ongoing trends or indecision in the market, showing that momentum is either steady or uncertain.
Table Of Contents
Did you know you can see whether the bulls or bears are winning just by looking at a chart? That’s the power of candlestick patterns. There are different types of candlestick patterns that help us see the price movements of any stock on the charts.
Each candlestick tells a comprehensive story, with the body and wicks of each candlestick revealing whether the bulls or bears are in control. Additionally, they provide key data such as the opening and closing prices, as well as the highest and lowest prices reached over a given period (day, week, or month).
It is important for any technical analyst in the stock market to understand the interpretation of candlestick chart patterns. By recognizing these patterns, they can make informed decisions about future price movements.
Candlestick patterns present a more visual presentation of the price action and give us more insights into how the prices will move further than bar charts.
In this blog, let’s understand how to read candlesticks and explore 35 important patterns that that help us understand the price movement of any securities.
What Are Candlestick Charts?
Candlestick charts were first developed in Japan in the 1700s by a rice trader named Homma.
He realized that price movements were influenced not only by supply and demand but also by trader emotions – greed and fear.
Each candlestick shows four key price points for a chosen time frame (day, week, or month):
- Open – The price at the start of the period
- High – The highest price during that period
- Low – The lowest price during that period
- Close – The price at the end of the period
How to Read Candlestick Charts?
The candlestick’s wide or rectangular part is called the “real body”, which shows the link between opening and closing prices.
This real body shows the price range between the open and close of that day’s trading.
When the real body is filled, black or red, then it means that the close is lower than the open and is known as the bearish candle. It shows that the prices opened, the bears pushed the prices down and closed lower than the opening price.
If the real body is empty, white or green, then it means that the close was higher than the open, known as the bullish candle. It shows that the prices opened, the bulls pushed the prices up and closed higher than the opening price.
The thin vertical lines above and below the real body are known as the wicks or shadows, which represent the high and low prices of the trading session.
The upper shadow shows the high price, and lower shadow shows the low prices reached during the trading session.
Bullish Candle
- Close > Open
- Usually shown in green or white
- Buyers were in control
Bearish Candle
- Close < Open
- Usually shown in red or black
- Sellers were in control
Important Points Before Reading Patterns
Before we jump into learning about different candlestick charts, there are a few assumptions that need to be kept in mind that are specific to the candlestick charts.
- Color shows strength: Green = strength & Red = weakness.
- Look for a prior trend:
- For a bullish reversal → prior trend should be down.
- For a bearish reversal → prior trend should be up.
- Textbook patterns may vary:
Real charts won’t always be perfect. Slight variations are normal.
35 Types of Candlestick Patterns:
Candlestick patterns are mainly divided into three categories:
- Bullish Reversal Patterns – Indicate a possible end of a downtrend.
- Bearish Reversal Patterns – Indicate a possible end of an uptrend.
- Continuation & Neutral Patterns – Indicate the trend is likely to continue or market indecision.
Below is the list of 35 Types of Candles in the stock market which is categorised in the above categories:
| Candlestick Pattern | Signal | Description |
|---|---|---|
| 1. Hammer | Bullish Reversal | Small body at the top with a long lower wick, indicating potential reversal. |
| 2. Piercing Pattern | Bullish Reversal | Bullish candle closes above the midpoint of the previous bearish candle. |
| 3.Bullish Engulfing | Bullish Reversal | Bullish candle completely engulfs the previous bearish candle. |
| 4.Morning Star | Bullish Reversal | Three-candle pattern indicating a potential bullish reversal. |
| 5.Three White Soldiers | Bullish Reversal | Three consecutive long bullish candles, suggesting strong buying pressure. |
| 6.White Marubozu | Bullish Continuation | Long bullish candle with no shadows, indicating strong buying interest. |
| 7.Three Inside Up | Bullish Reversal | Bullish candle follows a bearish candle, closing above the first candle’s open. |
| 8.Bullish Harami | Bullish Reversal | Small bullish candle within the range of the previous bearish candle. |
| 9.Tweezer Bottom | Bullish Reversal | Two candles with matching lows, suggesting a potential reversal. |
| 10.Inverted Hammer | Bullish Reversal | Small body with a long upper wick, appearing after a downtrend. |
| 11.Three Outside Up | Bullish Reversal | Bullish candle engulfs previous bearish candle, followed by another bullish candle. |
| 12.On-Neck Pattern | Bullish Continuation | Bearish candle followed by a bullish candle closing near the previous close. |
| 13.Bullish Counterattack | Bullish Reversal | Bearish candle followed by a bullish candle closing at the same level. |
| 14.Hanging Man | Bearish Reversal | Small body at the top with a long lower wick, indicating potential reversal. |
| 15.Dark Cloud Cover | Bearish Reversal | Bearish candle opens above the previous close and closes below the midpoint. |
| 16.Bearish Engulfing | Bearish Reversal | Bearish candle completely engulfs the previous bullish candle. |
| 17.Evening Star | Bearish Reversal | Three-candle pattern indicating a potential bearish reversal. |
| 18.Three Black Crows | Bearish Reversal | Three consecutive long bearish candles, suggesting strong selling pressure. |
| 19.Black Marubozu | Bearish Continuation | Long bearish candle with no shadows, indicating strong selling interest. |
| 20.Three Inside Down | Bearish Reversal | Bearish candle follows a bullish candle, closing below the first candle’s open. |
| 21.Bearish Harami | Bearish Reversal | Small bearish candle within the range of the previous bullish candle. |
| 22.Shooting Star | Bearish Reversal | Small body with a long upper wick, appearing after an uptrend. |
| 23.Tweezer Top | Bearish Reversal | Two candles with matching highs, suggesting a potential reversal. |
| 24.Three Outside Down | Bearish Reversal | Bearish candle engulfs previous bullish candle, followed by another bearish candle. |
| 25.Bearish Counterattack | Bearish Reversal | Bullish candle followed by a bearish candle closing at the same level. |
| 26.Doji | Neutral | Candle with open and close at the same level, indicating indecision. |
| 27.Spinning Top | Neutral | Small body with long upper and lower wicks, indicating indecision. |
| 28.Falling Three Methods | Bearish Continuation | Long bearish candle followed by small bullish candles, then another bearish candle. |
| 29.Rising Three Methods | Bullish Continuation | Long bullish candle followed by small bearish candles, then another bullish candle. |
| 30.Upside Tasuki Gap | Bullish Continuation | Bullish candle followed by a gap up and a bearish candle that doesn’t fill the gap. |
| 31.Downside Tasuki Gap | Bearish Continuation | Bearish candle followed by a gap down and a bullish candle that doesn’t fill the gap. |
| 32.Mat-Hold | Bullish Continuation | Bullish candle followed by small bearish candles, then another bullish candle. |
| 33.Rising Window | Bullish Continuation | Gap between two bullish candles, indicating strong buying pressure. |
| 34.Falling Window | Bearish Continuation | Gap between two bearish candles, indicating strong selling pressure. |
| 35.High Wave | Neutral | Candle with long upper and lower wicks and a small body, indicating volatility. |
Bullish Reversal Candlestick Patterns:
Bullish Reversal candlestick patterns indicate that the ongoing downtrend is going to reverse to an uptrend.
Thus, traders should be cautious about their short positions when the bullish reversal candlestick chart patterns are formed.
Below are the different types of bullish reversal candlestick patterns:
1. Hammer:
Hammer is a single candlestick pattern that is formed at the end of a downtrend and signals a bullish reversal.
- The candlestick has a small real body located near the top of the price range.
- It has a long lower shadow, which is more than twice the size of the real body.
- There is little to no upper shadow present.
Price action psychology:
- The session opened, and sellers initially pushed prices downward.
- Later, buyers entered the market strongly, reversing the fall.
- The price closed above the opening level, showing buying strength and potential bullish reversal.
This resulted in the formation of bullish pattern and signifies that buyers are back in the market and downtrend may end.
Traders can enter a long position if next day a bullish candle is formed and can place a stop-loss at the low of Hammer.
Below is an example of Hammer candlestick pattern:
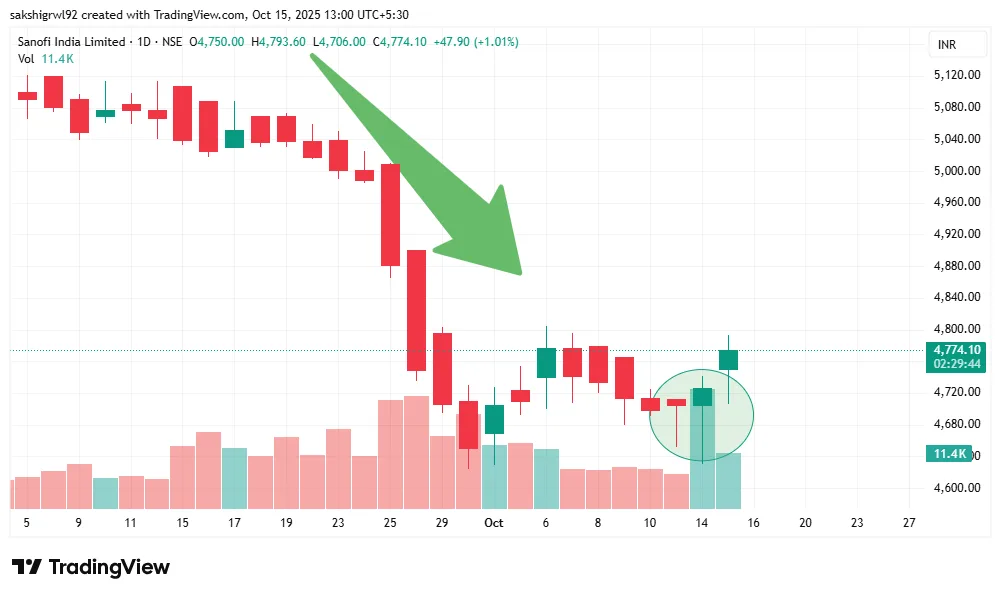
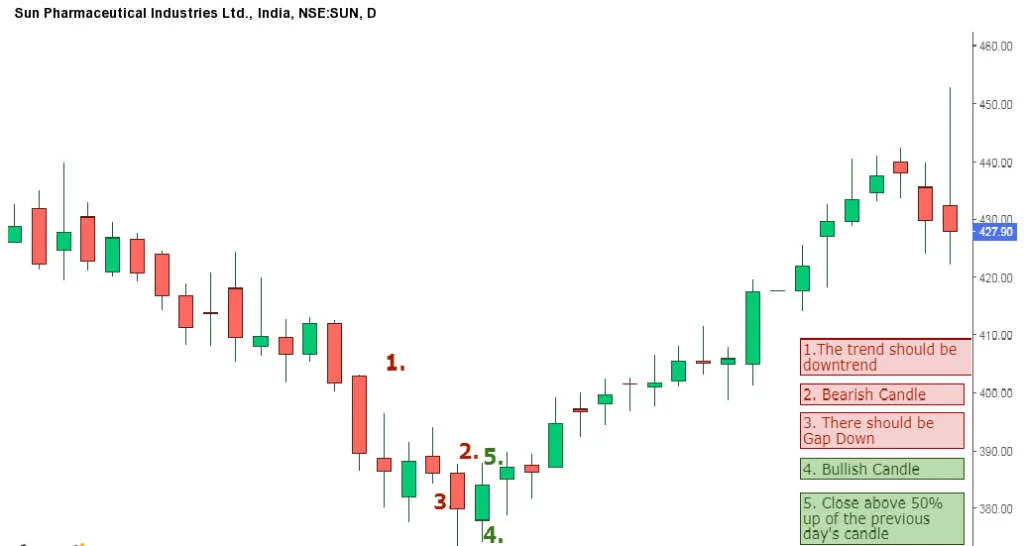
2. Piercing Pattern:
Piercing pattern is a multiple candlestick chart pattern formed after a downtrend indicating a bullish reversal.
- The pattern is formed by two candles.
- The first candle is bearish, indicating the continuation of the existing downtrend. The second candle is bullish and opens with a gap down.
- The bullish candle closes above the midpoint (more than 50%) of the previous bearish candle’s real body.
- This price action signals that buyers (bulls) are regaining control, suggesting a potential bullish reversal in the trend.
Traders can enter a long position if the next day a bullish candle is formed and can place a stop-loss at the low of the second candle.
Below is an example of a Piercing Candlestick Pattern:
/
Add a succinct headline
Write with clear, concise language to inform and engage your audience. Consider what matters to them and provide valuable insights.

3. Bullish Engulfing:
Bullish Engulfing is a multiple candlestick chart pattern that is formed after a downtrend indicating a bullish reversal.
- It is formed by two candles, the second candlestick engulfing the first candlestick.
- The first candle is a bearish candle that indicates the continuation of the downtrend.
- The second candlestick is a long bullish candle that completely engulfs the first candle and shows that the bulls are back in the market.
Traders can enter a long position if next day, a bullish candle is formed and can place a stop-loss at the low of the second candle.
Below is an example of a Bullish Engulfing Candlestick Pattern:
4. The Morning Star:
The Morning Star is a multiple candlestick chart pattern that is formed after a downtrend indicating a bullish reversal.
It is made of 3 candlesticks–
- the first being a bearish candle,
- the second a Doji and
- the third being a bullish candle.
The second candle should be completely out of the real bodies of the first and third candles.
Traders can enter a long position if the next day a bullish candle is formed and can place a stop-loss at the low of the second candle.
Below is an example of the Morning Star Candlestick Charts Pattern:
5. Three White Soldiers:
The Three White Soldiers is a multiple candlestick pattern that is formed after a downtrend indicating a bullish reversal.
These candlestick charts are made of three long bullish bodies which do not have long shadows and are open within the real body of the previous candle in the pattern.
6. White Marubozu:
The White Marubozu is a single candlestick pattern that is formed after a downtrend indicating a bullish reversal.
This candlestick has a long bullish body with no upper or lower shadows, which shows that the bulls are exerting buying pressure, and the markets may turn bullish.
At the formation of this candle, the sellers should be cautious and close their shorting position.
7. Three Inside Up:
The Three Inside Up is a multiple candlestick pattern formed after a downtrend indicating bullish reversal.
It consists of three candlesticks,
- the first being a long bearish candle
- the second candlestick being a small bullish candle which should be in the range the first candlestick.
- The third candlestick should be a long bullish candlestick confirming the bullish reversal.
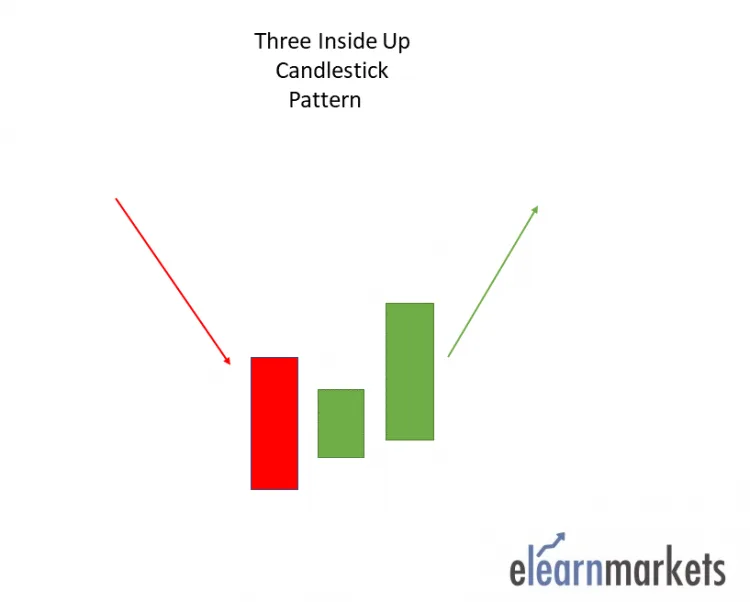
The relationship of the first and second candlestick should be of the bullish harami candlestick pattern.
Traders can take a long position after the completion of this candlestick pattern.
8. Bullish Harami:
The Bullish Harami is multiple candlestick chart pattern which is formed after a downtrend indicating bullish reversal.
It consists of two candlestick chart,
- The first candlestick is a tall bearish candle and
- Second, there is a small bullish candle, which should be in the range of the first candlestick
- The first bearish candle shows the continuation of the bearish trend and the second candle shows that the bulls are back in the market.
Traders can take a long position after the completion of this candlestick pattern.
9. Tweezer Bottom:
The Tweezer Bottom candlestick pattern is a bullish reversal candlestick pattern that is formed at the end of the downtrend.
It consists of two candlesticks, the first one being bearish and the second one being bullish candlestick.
Both the candlesticks make almost or the same low.When the Tweezer Bottom candlestick pattern is formed the prior trend is a downtrend.
A bearish tweezer candlestick is formed, which looks like the continuation of the ongoing downtrend. On the next day, the second day’s bullish candle’s low indicates a support level.
The bottom-most candles with almost the same low indicate the strength of the support and also signal that the downtrend may get reversed to form an uptrend. Due to this, the bulls step into action and move the price upwards.
This bullish reversal is confirmed the next day when the bullish candle is formed.
10. Inverted Hammer:
An Inverted Hammer is formed at the end of the downtrend and gives a bullish reversal signal.
In this candlestick, the real body is located at the end, and there is a long upper shadow. It is the inverse of the Hammer Candlestick pattern.
This pattern is formed when the opening and closing prices are near to each other, and the upper shadow should be more than twice the real body.
11. Three Outside Up:
The Three Outside Up is a multiple candlestick pattern that forms after a downtrend, indicating a bullish reversal.
It consists of three candlesticks, the first being a short bearish candle, the second candlestick being a large bullish candle which should cover the first candlestick.
The third candlestick should be a long bullish candlestick confirming the bullish reversal.
The relationship of the first and second candlestick chart should be of the Bullish Engulfing candlestick pattern.
Traders can take a long position after the completion of this candlestick pattern.
12. On-neck Pattern:
The On-neck pattern occurs after a downtrend when a long real-bodied bearish candle is followed by a smaller real-bodied bullish candle, which gaps down on the open but then closes near the prior candle’s close.
The pattern is called a neckline because the two closing prices are the same or almost the same across the two candles, forming a horizontal neckline.
13. Bullish Counterattack:
The Bullish Counterattack pattern is a bullish reversal pattern that predicts the upcoming reversal of the current downtrend in the market. This candlestick pattern is a two-bar pattern that appears during a downtrend in the market. A pattern needs to meet the following conditions to be a bullish counterattack pattern.
- There must be a strong downtrend in the market for the formation of the bullish counterattack pattern.
- The first candle must be a long black candle with a real body.
- The second candle must also be a long (ideally, equal in size to the first candle) but a white candle with a real body. The second candle must close near the close of the first candle.
Bearish Reversal Candlestick Patterns:
Bearish Reversal candlestick patterns indicate that the ongoing uptrend is going to reverse to a downtrend.
Thus, the traders should be cautious about their long positions when the bearish reversal candlestick patterns are formed.
Below are the different types of bearish reversal candlestick chart patterns:
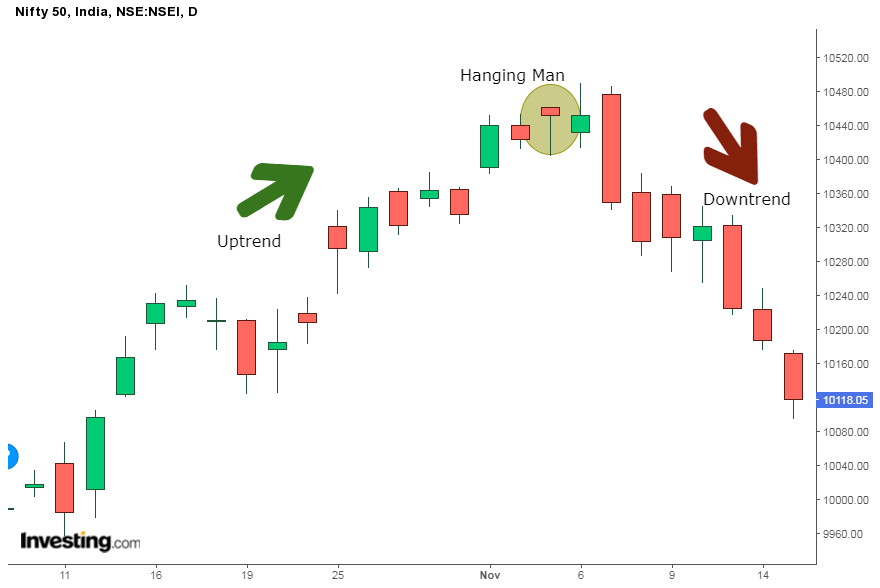
14. Hanging man:
Hanging Man is a single candlestick pattern that is formed at the end of an uptrend and signals a bearish reversal.
The real body of this candle is small and is located at the top with a lower shadow which should be more than twice the real body. This candlestick pattern has no or little upper shadow.
The psychology behind this candle formation is that the prices opened, and the seller pushed down the prices.
Suddenly the buyers came into the market and pushed the prices up but were unsuccessful in doing so, as the prices closed below the opening price.
This resulted in the formation of bearish pattern and signifies that seller are back in the market and uptrend may end.
Traders can enter a short position if next day a bearish candle is formed and can place a stop-loss at the high of the Hanging Man.
Below is an example of Hanging Man Candlestick Pattern:
15. Dark cloud cover:
Dark Cloud Cover is a multiple candlestick pattern formed after the uptrend indicating a bearish reversal.
It is formed by two candles, the first candle being a bullish candle which indicates the continuation of the uptrend.
The second candle is a bearish candle which opens the gap up but closes more than 50% of the real body of the previous candle, which shows that the bears are back in the market and a bearish reversal is going to take place.
Traders can enter a short position if the next day a bearish candle is formed and can place a stop-loss at the high of the second candle.
Below is an example of a Dark Cloud candlestick pattern:;
16. Bearish Engulfing:
Bearish Engulfing is a multiple candlestick pattern that is formed after an uptrend indicating a bearish reversal.
It is formed by two candles, the second candlestick engulfing the first candlestick. The first candle being a bullish candle indicates the continuation of the uptrend.
The second candlestick chart is a long bearish candle that completely engulfs the first candle and shows that the bears are back in the market.
Traders can enter a short position if next day a bearish candle is formed and can place a stop-loss at the high of the second candle.
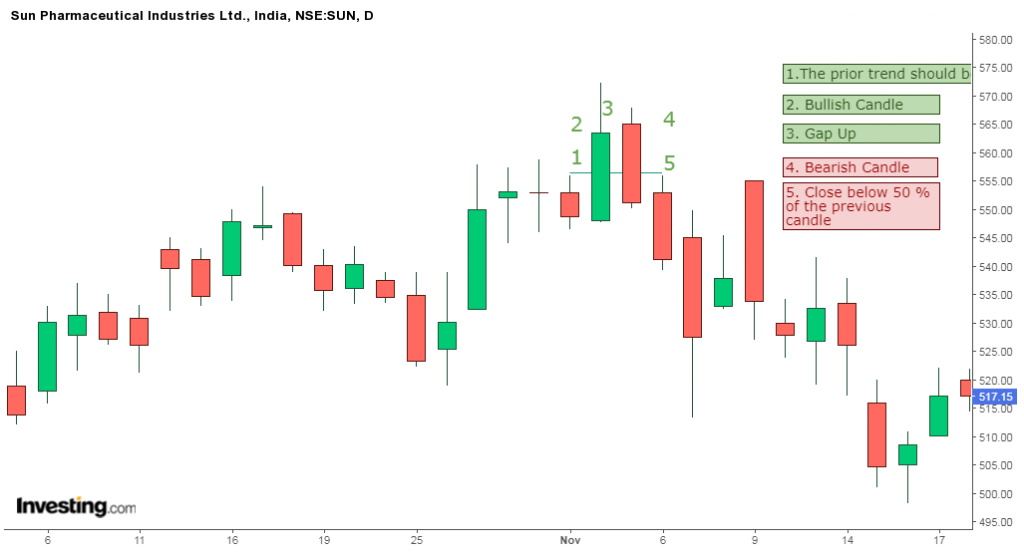
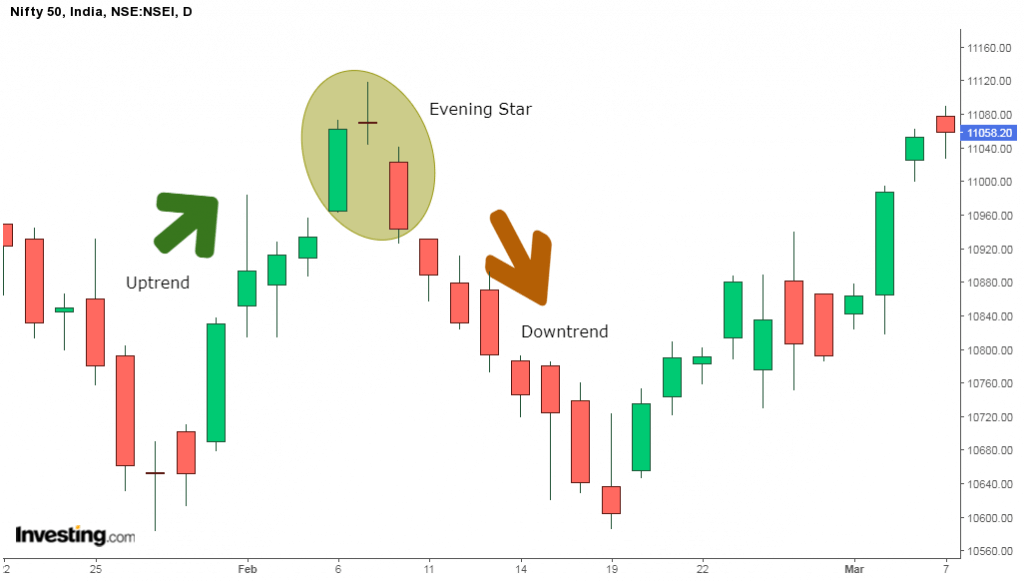
17. The Evening Star:
The Evening Star is a multiple candlestick pattern that is formed after the uptrend indicating a bearish reversal.
It is made of 3 candlesticks, the first being a bullish candle, the second a doji, and the third being a bearish candle.
The first candle shows the continuation of the uptrend, the second candle being a doji indicates indecision in the market, and the third bearish candle shows that the bears are back in the market and reversal is going to take place.
The second candle should be completely out of the real bodies of the first and third candles.
Traders can enter a long position if next day a bearish candle is formed and can place a stop-loss at the high of the second candle.
Below is an example of the Evening Star Candlestick Pattern:
18. Three Black Crows:
The Three Black Crows is a multiple candlestick pattern that is formed after an uptrend indicating a bearish reversal.
These candlesticks are made of three long bearish bodies that do not have long shadows and open within the real body of the previous candle in the pattern.
19. Black Marubozu:
The Black Marubozu is a single candlestick pattern which is formed after an uptrend indicating bearish reversal.
This candlestick chart has a long bearish body with no upper or lower shadows which shows that the bears are exerting selling pressure and the markets may turn bearish.
At the formation of this candle, the buyers should be caution and close their buying position.
20. Three Inside Down:
The Three Inside Down is a multiple candlestick pattern that is formed after an uptrend indicating a bearish reversal.
It consists of three candlesticks, the first being a long bullish candle, the second candlestick being a small bearish, which should be in the range of the first candlestick.
The third candlestick chart should be a long bearish candlestick confirming the bearish reversal.
The relationship of the first and second candlestick should be of the bearish Harami candlestick pattern.
Traders can take a short position after the completion of this candlestick pattern.
21. Bearish Harami:
The Bearish Harami is a multiple candlestick pattern formed after the uptrend indicating bearish reversal.
It consists of two candlesticks, the first candlestick being a tall bullish candle and second being a small bearish candle which should be in the range of the first candlestick chart.
The first bullish candle shows the continuation of the bullish trend and the second candle shows that the bears are back in the market.
Traders can take a short position after the completion of this candlestick pattern.
22. Shooting Star:
Shooting Star is formed at the end of the uptrend and gives a bearish reversal signal.
In this candlestick chart, the real body is located at the end, and there is a long upper shadow. It is the inverse of the Hanging Man Candlestick pattern.
This pattern is formed when the opening and closing prices are near to each other, and the upper shadow should be more than twice the real body.
23. Tweezer Top:
The Tweezer Top pattern is a bearish reversal candlestick pattern that is formed at the end of an uptrend.
It consists of two candlesticks, the first one being bullish and the second one being bearish candlestick. Both the tweezer candlesticks are almost or the same height.
When the Tweezer Top candlestick pattern is formed, the prior trend is an uptrend. A bullish candlestick is formed, which looks like the continuation of the ongoing uptrend.
On the next day, the high of the second day’s bearish candle’s high indicates a resistance level. Bulls seem to raise the price upward, but now they are not willing to buy at higher prices.
The top-most candles with almost the same high indicate the strength of the resistance and also signal that the uptrend may get reversed to form a downtrend. This bearish reversal is confirmed on the next day when the bearish candle is formed.
24. Three Outside Down:
The Three Outside Down is a multiple candlestick pattern formed after an uptrend, indicating a bearish reversal.
It consists of three candlesticks, the first being a short bullish candle, the second candlestick being a large bearish candle which should cover the first candlestick.
The third candlestick should be a long bearish candlestick confirming the bearish reversal.
The relationship of the first and second candlestick should be of the Bearish Engulfing candlestick pattern.
Traders can take a short position after the completion of this candlestick pattern.
25. Bearish Counterattack:
The bearish counterattack candlestick pattern is a bearish reversal pattern that appears during an uptrend in the market. It predicts that the current uptrend in the market will make and the new downtrend will take over the market.
Continuation & Neutral Candlestick Patterns:
26. Doji:
Doji candlestick pattern is a price action candlestick pattern of indecision that is formed when the opening and closing prices are almost equal.
It is formed when both the bulls and bears are fighting to control prices but nobody succeeds in gaining full control of the prices.
The candlestick pattern looks like a cross with a very small real body and long shadows.
27. Spinning Top:
The Spinning Top candlestick pattern is the same as the Doji, indicating indecision in the market.
The only difference between the spinning top and the doji is in their formation, the real body of the spinning is larger as compared to the Doji.
28. Falling Three Methods:
The Falling Three Methods is a bearish, five-candle continuation pattern that signals an interruption, but not a reversal, of the ongoing downtrend.
The candlestick pattern is made of two long candlestick charts in the direction of the trend i.e. downtrend at the beginning and end, with three shorter counter-trend candlesticks in the middle.
The candlestick pattern is important as it shows traders that the bulls still do not have enough power to reverse the trend.
29. Rising Three Methods:
The Rising Three Methods is a bullish, five-candle continuation pattern that signals an interruption, but not a reversal, of the ongoing uptrend.
The candlestick pattern is made of two long candlesticks in the direction of the trend i.e. uptrend in this case. At the beginning and end, with three shorter counter-trend candlesticks in the middle.
The candlestick pattern is important as it shows traders that the bears still do not have enough power to reverse the trend.
30. Upside Tasuki Gap:
It is a bullish continuation candlestick pattern that is formed in an ongoing uptrend.
This candlestick pattern consists of three candles, the first candlestick is a long-bodied bullish candlestick, and the second candlestick is also a bullish candlestick chart formed after a gap up.
The third candlestick is a bearish candle that closes in the gap formed between these first two bullish candles.
31. Downside Tasuki Gap:
It is a bearish continuation candlestick pattern that is formed in an ongoing downtrend.
This candlestick pattern consists of three candles, the first candlestick is a long-bodied bearish candlestick, and the second candlestick is also a bearish candlestick formed after a gap down.
The third candlestick is a bullish candle that closes in the gap formed between these first two bearish candles.
32. Mat Hold:
A Mat Hold pattern is a candlestick formation indicating the continuation of a prior trend.
There can be either bearish or bullish mat hold patterns. A bullish pattern begins with a large bullish candle followed by a gap higher and three smaller candles which move lower.
These candles must stay above the low of the first candle. The fifth candle is a large candle that moves to the upside again. The pattern occurs within an overall uptrend.
33. Rising Window:
The Rising Window is a candlestick pattern consisting of two bullish candlesticks with a gap between them. The gap is the space between the high and low of two candlesticks that occurs due to high trading volatility. It is a trend continuation candlestick pattern indicating the strength of buyers in the market.
34. Falling Window:
The Falling Window is a candlestick pattern that consists of two bearish candlesticks with a gap between them. The gap is the space between the high and low of two candlesticks. it occurs due to high trading volatility. It is a trend continuation candlestick pattern, and it is an indication of the strength of sellers in the market.
35. High Wave:
The High Wave candlestick pattern is an indecision pattern that shows the market is neither bullish nor bearish. It mostly occurs at support and resistance levels. This is where bears and bulls battle each other in an effort of trying to push the price in a given direction. This type of candlestick depicts the pattern with long lower shadows and long upper wicks. Likewise, they have small bodies. The long wicks signal that there was a large amount of price movement during the given period. However, the price ultimately ended up closing near the opening price.
You can also download our eBooks on to get access to candlestick patterns in PDF format.
You can also watch the video on candlestick charts from here:
Bottomline:
One should remember that all candlestick patterns that we have discussed above should always be used with other technical indicators, as sometimes the signals generated by these patterns can be false.
The above list of candlestick patterns helps in understanding the different types of candlesticks and their meanings.
Frequently Asked Questions (FAQs)
What is the candlestick pattern?
Candlesticks are charts that show how prices have changed over a specific time period. They are frequently created by a financial instrument’s opening, high, low, and closing prices. When the opening price surpasses the closing price, a filled candlestick—typically black or red—is produced.
Which candlestick pattern is bearish?
The “falling three methods” are the name given to this bearish pattern. It is composed of three small green bodies, a long red body, and another red body. The green candles are all confined inside the bearish bodies’ range. It demonstrates to traders that the bulls lack the strength to buck the trend.
What is the 15-minute candlestick strategy?
Traders may be able to profit from changes in market sentiment by spotting inside candles on a 15-minute timeframe chart and trading in the direction of the breakout.
Which time frame is best for trading?
If you want to see the main trends and movements during the trading day, rather than just the small fluctuations (5-minute and, to a greater extent, 1-minute charts), choose a 10- or 15-minute chart time frame. Develop and test the technique on a 15-minute chart if you